Telemetrics
This guide describes the Clear Linux* OS telemetry solution.
Important
Telemetry in Clear Linux OS is opt-in. The telemetry client is not active and sends no data until you explicitly enable it.
Note
The telemetry functionality adheres to Intel privacy policies regarding the collection and use of PII and is open source.
No intentionally identifiable information about the user or system owner is collected.
Overview
Telemetrics in Clear Linux OS is a client and server solution used to collect data from running Clear Linux OS systems to help quickly identify and fix bugs in the OS. Both client and server are customizable, and an API is available on the client side for instrumenting your code for debug and analysis.
Telemetry, one of the key features of Clear Linux OS, enables developers to observe and proactively address issues in the OS before end users are impacted.
Telemetrics is a portmanteau word made from:
Telemetry, which is sensing and reporting data.
Analytics, which is using visualization and statistical inferencing to make sense of the reported data.
Clear Linux OS telemetry reports system-level debug/crash information using specialized probes. The probes monitor system tasks such as swupd, kernel oops, machine error checks, and the BIOS error report table for unhandled hardware failures. Telemetry enables real-time issue reporting to allow system developers to focus quickly on an issue and monitor corrective actions.
Clear Linux OS telemetry is fully customizable and can also be used during software development for debugging purposes. You can use the libtelemetry library in your code to create custom telemetry records. You can also use the telem-record-gen utility in script files for light-touch record creation where instrumenting code files doesn’t make sense. For more information on configuring the telemetry client, refer to section Client Configuration.
The Clear Linux OS telemetrics solution is an opt-in choice on the client side. By default, the telemetry client is disabled until you choose to enable it. Enabling the client is covered in this guide.
Architecture
Clear Linux OS telemetry has two fundamental components, which are shown in Figure 1:
Client, which generates and delivers records to the backend server via the network.
Backend, which receives records sent from the client and displays the cumulative content through a specialized web interface.
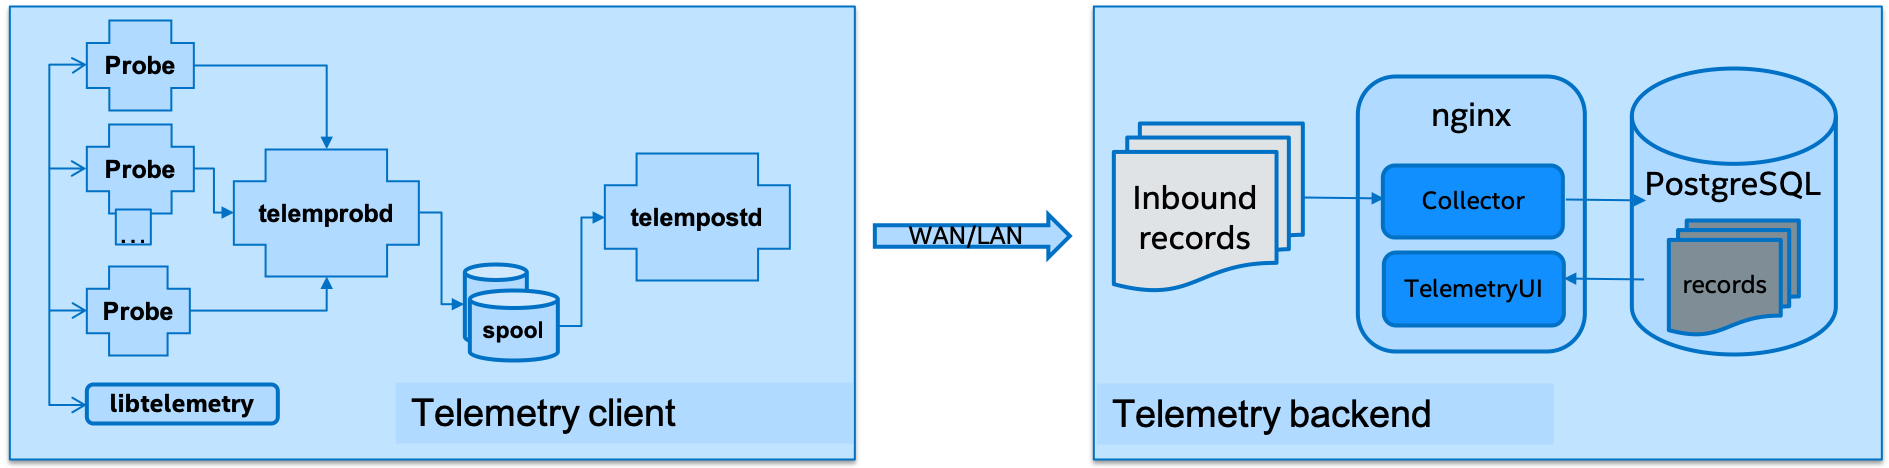
Figure 1: |CL| Telemetry Architecture
The telemetry client provides the front end of the telemetrics solution and includes the following components:
telemprobd, which is a daemon that receives and prepares telemetry records from probes and spools them to disk.
telempostd, which is a daemon that manages spooled telemetry records and delivers these records according to configurable settings.
probes, which collect specific types of data from the operating system.
libtelemetry, which is the API that telemetrics probes use to create records.
The telemetry backend provides the server-side component of the telemetrics solution and consists of:
Nginx web server.
Two Flask apps:
Collector, which is an ingestion web app for records received from client probes.
TelemetryUI, which is a web app that exposes different views to visualize the telemetry data.
PostgreSQL as the underlying database server.
Note
The default telemetry backend server is hosted by the Intel Clear Linux OS development team and is not viewable outside the Intel firewall. To collect your own records, you must set up your own telemetry backend server.
How to use
From a workflow perspective, the Clear Linux OS telemetrics system is straightforward. On the client side, the main decisions after installation and enabling telemetry involve what to do with the record data generated by the probes. You can send the data to the default telemetry server or a custom backend server, keep the data local to the system, or both. The backend server has a more complex setup, but once it’s running, it is simple to configure and use.
This section describes some of the possible scenarios for configuring the Clear Linux OS telemetrics system, and suggests which ones make sense according to your needs.
For more information on configuring the telemetry client, refer to section Client Configuration.
Scenarios
Enable telemetry:
You must opt-in and start telemetry before probes can generate records. You can configure the client before starting telemetry by creating a custom
telemetrics.conffile that you place in the/etc/telemetricsdirectory. If you choose to use the built-in default settings, records will be sent to the telemetrics backend server managed by the Clear Linux OS development team at Intel.Save record data locally:
You can configure the telemetry client to save records locally. This is convenient when you want instant feedback during a development cycle, or to track system issues if you believe there is a machine-specific problem. The client can be set not to send records at all or to both keep the records locally and send to the backend server.
Set up a server to collect data:
Whether you are managing a network of Clear Linux OS systems or you don’t want to send records to the default telemetry server, you can set up a backend server to collect your records. The backend server can be installed on any Linux system and provides the same dashboard as the default server.
Instrument your code with the libtelemetry API:
The telemetrics bundle includes the libtelemetry C library, which exposes an API used by the telemprobd and telempostd daemons. You can use these in your applications as well. The API documentation is located in the
telemetry.hfile in Telemetrics client repository.
Examples
Enable or disable telemetry
Enabling during installation:
During the initial installation of Clear Linux OS, you are requested to join the stability enhancement program and allow Clear Linux OS to collect anonymous reports to improve system stability. If you choose not to join this program, then the telemetry software bundle is not added to your system. If you do choose to join the program, the installer will automatically enable telemetry on your system by installing the telemetrics bundle, creating the file
/etc/telemetrics/opt-in, and enabling the telemetrics systemd services to run after installation is complete and the system is restarted.Enabling after install:
To install telemetry on your system, run the following commands:
sudo swupd bundle-add telemetrics
sudo telemctl opt-in
sudo telemctl start
This installs the necessary software, enables telemetry by creating the file
/etc/telemetrics/opt-in, and starts the telemprobd and telempostd daemons. Your system will begin to send telemetry data to the backend server.Disabling after install:
To disable both of the telemetry daemons, run the following command:
sudo telemctl stop
Opt in to telemetry:
To opt-in to the telemetry services, simply enter the opt-in command:
sudo telemctl opt-in
sudo telemctl start
This creates the
/etc/telemetrics/opt-infile, if it doesn’t already exist. You will need to explicitly start the telemetry services after you have opted in.Opt out of telemetry:
To stop sending telemetrics data from your system, opt out of the telemetry service:
sudo telemctl opt-out
This removes the file
/etc/telemetrics/opt-inand stops the telemetry services.
Saving data locally
This example requires Clear Linux OS to be installed and telemetry to be enabled on the system.
To change how records are managed, copy the default
/usr/share/defaults/telemetrics/telemetrics.conf file to
/etc/telemetrics/telemetrics.conf and edit it. The changes in the
/etc/telemetrics/telemetrics.conf file will override the built-in
defaults referenced in the
/usr/share/defaults/telemetrics/telemetrics.conf file.
You will need root permissions to create and edit files in /etc. For
each example, and for any time you make changes to the configuration file,
you must restart the client daemons to pick up the changes:
sudo telemctl restart
The telemctl journal command gives you access to features and options of the telemetry journal to assist with system analytics and debug. telemctl journal has a number of options to help filter records. Use -h or --help to view usage options.
Keep a local copy and send records to backend server:
To keep a local copy of the telemetry record and also send it on to the backend server, we will need to change the record_retention_enabled configuration key value to true.
Keep all records – don’t send to backend server:
To keep records on the system without sending them to a backend server, set the record_server_delivery_enabled key value to false. Note that you will also need to ensure the record_retention_enabled configuration key value is set to true or the system will not keep local copies.
Keep and send records to custom server:
This assumes you have set up a custom server according to the next example.
The server is identified by the server setting, and by default records are sent to the Clear Linux OS server server=https://clr.telemetry.intel.com/v2/collector. To change this, you can use an IP address or fully qualified domain name.
Set up a backend server to collect telemetry records
For this example, start with a clean installation of Clear Linux OS on a new system using the Install Clear Linux* OS from the live server getting started guide and:
Join the Stability Enhancement Program to install and enable the telemetrics components.
Select the manual installation method with the following settings:
Set the hostname to clr-telem-server,
Create an administrative user named clear and add this user to sudoers
Log in with your administrative user, from your
$HOMEdirectory, run git to clone the telemetrics-backend repository into the$HOME/telemetrics-backenddirectory:git clone https://github.com/clearlinux/telemetrics-backendNote
You may need to set up the
https_proxyenvironment variable if you have issues reaching github.com.Change your current working directory to
telemetrics-backend/scripts.Before you install the telemetrics backend with the
deploy.shscript file in the next step, here is an explanation of the options to be specified:-a install to perform an install
-d clr to install to a Clear Linux OS distro
-H localhost to set the domain to localhost
Caution
The
deploy.shshell script has minimal error checking and makes several changes to your system. Be sure that the options you define on the cmdline are correct before proceeding.Run the shell script from the
$HOME/telemetrics-backend/scriptsdirectory:./deploy.sh -H localhost -a install -d clrThe script starts and lists all the defined options and prompts you for the PostgreSQL database password.
Options:
 host: localhost
 distro: clr
 action: install
 repo: https://github.com/clearlinux/telemetrics-backend
 source: master
 type: git
 DB password: (default: postgres):
For the DB password:, press the Enter key to accept the default password postgres.
Note
The
deploy.shscript uses sudo to run commands and you may be prompted to enter your user password at any time while the script is executing. If this occurs, enter your user password to execute the sudo command.After all the server components have been installed, you are prompted to enter the PostgreSQL database password to change it as illustrated below:
Enter password for 'postgres' user:
New password:
Retype new password:
passwd: password updated successfully
Enter postgres for the current value of the password and then enter a new password. Retype it to verify the new password and the PostgreSQL database password will be updated.
After the installation is complete, you can use your web browser to view the new server by opening the browser on the system and typing in localhost in the address bar. You should see a web page similar to the one shown in Figure 2 below.
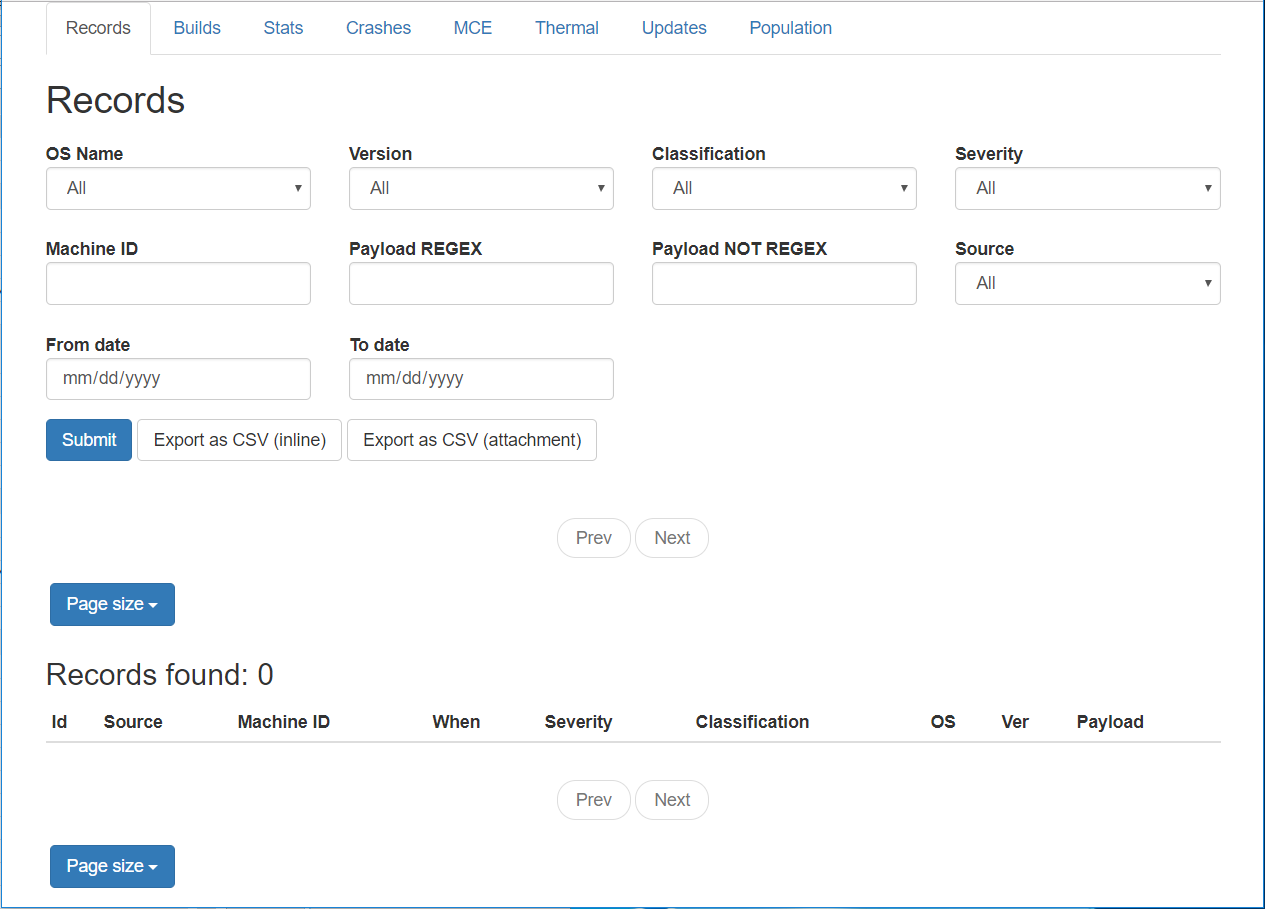
Figure 2: Telemetry UI
Create records with telem-record-gen
The telemetrics bundle provides a record generator tool called telem-record-gen. This tool can be used to create records from shell scripts or the command line when it is not desirable to write a probe in C. Records are sent to the backend server, and can also be echoed to stdout.
There are three ways to supply the payload to the record:
On the command line, use the -p <string> option:
telem-record-gen -c a/b/c -n -o -p 'payload goes here'
record_format_version: 4
classification: a/b/c
severity: 1
machine_id: FFFFFFFF
creation_timestamp: 1539023189
arch: x86_64
host_type: innotek GmbH|VirtualBox|1.2
build: 25180
kernel_version: 4.14.71-404.lts
payload_format_version: 1
system_name: clear-linux-os
board_name: VirtualBox|Oracle Corporation
cpu_model: Intel(R) Core(TM) i7-4650U CPU @ 1.70GHz
bios_version: VirtualBox
event_id: 2236710e4fc11e4a646ce956c7802788

payload goes here
Specify a file that contains the payload with the option -P path/to/file.
telem-record-gen -c a/b/c -n -o -P ./payload_file.txt
record_format_version: 4
classification: a/b/c
severity: 1
machine_id: FFFFFFFF
creation_timestamp: 1539023621
arch: x86_64
host_type: innotek GmbH|VirtualBox|1.2
build: 25180
kernel_version: 4.14.71-404.lts
payload_format_version: 1
system_name: clear-linux-os
board_name: VirtualBox|Oracle Corporation
cpu_model: Intel(R) Core(TM) i7-4650U CPU @ 1.70GHz
bios_version: VirtualBox
event_id: d73d6040afd7693cccdfece479df9795

payload read from file
If the -p or -P options are absent, the tool reads from stdin so you can use it in a
heredocin scripts.#telem-record-gen -c a/b/c -n -o << HEOF payload read from stdin HEOF
record_format_version: 4
classification: a/b/c
severity: 1
machine_id: FFFFFFFF
creation_timestamp: 1539023621
arch: x86_64
host_type: innotek GmbH|VirtualBox|1.2
build: 25180
kernel_version: 4.14.71-404.lts
payload_format_version: 1
system_name: clear-linux-os
board_name: VirtualBox|Oracle Corporation
cpu_model: Intel(R) Core(TM) i7-4650U CPU @ 1.70GHz
bios_version: VirtualBox
event_id: 2f070e8e71679f2b1f28794e3a6c42ee

payload read from stdin
Set a static machine id
The machine id reported by the telemetry client is rotated every three days
for privacy reasons. If you wish to have a static machine id for testing
purposes, you can opt in by creating a file named
opt-in-static-machine-id in the directory /etc/telemetrics/.
Create a directory
telemetrics.sudo mkdir -p /etc/telemetrics
Create the file and replace the “unique machine ID” with your desired static machine ID.
echo "unique machine ID" | sudo tee /etc/telemetrics/opt-in-static-machine-id
Note
The machine ID is different from the system hostname.
Instrument your code with the libtelemetry API
Prerequisites
Confirm that the telemetrics header file is located on the system at
usr/include/telemetry.h. The latest version of the file can also
be found on github for reference, but installing the telemetrics
bundle will install the header file that matches your Clear Linux OS version.
Includes and variables:
You must include the following headers in your code to use the API:
#define _GNU_SOURCE
#include <stdlib.h>
#include <stdio.h>
#include <string.h>
#include <telemetry.h>
Use the following code to create the variables needed to hold the data for the record to be created:
uint32_t severity = 1;
uint32_t payload_version = 1;
char classification[30] = "org.clearlinux/hello/world";
struct telem_ref *tm_handle = NULL;
char *payload;
int ret = 0;
- Severity:
Type: uint32_t Value: Severity field value. Accepted values are in the range 1-4, with 1 being the lowest severity and 4 being the highest severity. Values provided outside of this range are clamped to 1 or 4 [low, med, high, crit].
- Payload_version:
Type: uint32_t Value: Payload format version. The only currently supported value is 1, which indicates that the payload is a freely-formatted (unstructured) string. Values greater than 1 are reserved for future use.
- Classification:
Type: char array Value: It should have the form, DOMAIN/PROBENAME/REST: DOMAIN is the reverse domain to use as a namespace for the probe (e.g. org.clearlinux), PROBENAME is the name of the probe, and REST is an arbitrary value that the probe should use to classify the record. The maximum length for the classification string is 122 bytes. Each sub-category may be no longer than 40 bytes long. Two '/' delimiters are required.
- Tm_handle:
Type: Telem_ref struct pointer Value: Struct pointer declared by the caller. The struct is initialized if the function returns success.
- Payload:
Type: char pointer Value: The payload to set.
For this example, we’ll set the payload to “hello” by using asprintf():
if (asprintf(&payload, "hello\n") < 0) {
  exit(EXIT_FAILURE);
   }
The functions asprintf() and vasprintf() are analogs of sprintf(3) and vsprintf(3), except that they allocate a string large enough to hold the output including the terminating null byte (’0’), and return a pointer to it via the first argument. This pointer should be passed to free(3) to release the allocated storage when it is no longer needed.
Create the new telemetry record:
The function tm_create_record() initializes a telemetry record and sets the severity and classification of that record, as well as the payload version number. The memory needed to store the telemetry record is allocated and should be freed with tm_free_record() when no longer needed.
if ((ret = tm_create_record(&tm_handle, severity,    classification, payload_version)) < 0) {
printf("Failed to create record: %s\n", strerror(-ret));
ret = 1;
goto fail;
}
Set the payload field of a telemetrics record:
The function tm_set_payload() attaches the provided telemetry record data to the telemetry record. The current maximum payload size is 8192b.
if ((ret = tm_set_payload(tm_handle, payload)) < 0) {
   printf("Failed to set record payload: %s\n", strerror(-ret));
   ret = 1;
   goto fail;
}
free(payload);
The free() function frees the memory space pointed to by ptr, which must have been returned by a previous call to malloc(), calloc(), or realloc(). Otherwise, or if free(ptr) has already been called before, undefined behavior occurs. If ptr is NULL, no operation is performed.
Send a record to the telemetrics daemon:
The function tm_send_record() delivers the record to the local telemprobd(1) service. Since the telemetry record was allocated by the program it should be freed with tm_free_record() when it is no longer needed.
if ((ret = tm_send_record(tm_handle)) < 0) {
   printf("Failed to send record to daemon: %s\n", strerror(-ret));
   ret = 1;
   goto fail;
} else {
   printf("Successfully sent record to daemon.\n");
   ret = 0;
}
fail:
tm_free_record(tm_handle);
tm_handle = NULL;

return ret;
A full sample application with compiling flags:
Create a new file
test.cand add the following code:#define _GNU_SOURCE #include <stdlib.h> #include <stdio.h> #include <string.h> #include <telemetry.h> int main(int argc, char **argv) { uint32_t severity = 1; uint32_t payload_version = 1; char classification[30] = "org.clearlinux/hello/world"; struct telem_ref *tm_handle = NULL; char *payload; int ret = 0; if (asprintf(&payload, "hello\n") < 0) { exit(EXIT_FAILURE); } if ((ret = tm_create_record(&tm_handle, severity, classification, payload_version)) < 0) { printf("Failed to create record: %s\n", strerror(-ret)); ret = 1; goto fail; } if ((ret = tm_set_payload(tm_handle, payload)) < 0) { printf("Failed to set record payload: %s\n", strerror(-ret)); ret = 1; goto fail; } free(payload); if ((ret = tm_send_record(tm_handle)) < 0) { printf("Failed to send record to daemon: %s\n", strerror(-ret)); ret = 1; goto fail; } else { printf("Successfully sent record to daemon.\n"); ret = 0; } fail: tm_free_record(tm_handle); tm_handle = NULL; return ret; }
Compile with the gcc compiler, using this command:
gcc test.c -ltelemetry -o test_telem
Test to ensure the program is working:
./test_telem
Successfully sent record to daemon.
Note
A full example of the heartbeat probe in C is documented in the source code.
Reference
The telemetry API
Installing the telemetrics bundle includes the libtelemetry C
library, which exposes an API used by the telemprobd and telempostd daemons.
You can use these in your applications as well. The API documentation is found
in the telemetry.h file in Telemetrics client repository.
Client configuration
The telemetry client will look for the configuration file located at
/etc/telemetrics/telemetrics.conf and use it if it exists. If the
file does not exist, the client will use the default configuration defined
at build time. There is a sample configuration file located at
/usr/share/defaults/telemetrics/telemetrics.conf and represents the
default values that are used when the programs are built. To modify or
customize the configuration, copy the file from
/usr/share/defaults/telemetrics/telemetrics.conf to the file
/etc/telemetrics/telemetrics.conf and edit it to add your
customizations.
sudo mkdir -p /etc/telemetrics
cp /usr/share/defaults/telemetrics/telemetrics.conf /etc/telemetrics/telemetrics.conf
Note
Telemetrics configuration is a layered mechanism since the defaults are
defined at build time and each field can be overwritten individually.
Therefore you only need to add the specific field that you want to change
from the default value to your customized value in the
/etc/telemetrics/telemetrics.conf file.
Configuration options
The client can use the following configuration options from the config file:
- server
This specifies the web server to which telempostd sends the telemetry records.
- socket_path
This specifies the path of the unix domain socket on which telemprobd listens for connections from the probes.
- spool_dir
This configuration option is related to spooling. If the daemon is not able to send the telemetry records to the backend server due to reasons such as the network availability, then it stores the records in a spool directory. This option specifies the path of the spool directory. This directory should be owned by the same user as the daemon.
- record_expiry
This is the time, in minutes, after which the records in the spool directory are deleted by the daemon.
- spool_process_time
This specifies the time interval, in seconds, that the daemon waits before checking the spool directory for records. The daemon picks up the records in the order of modification date and tries to send the record to the server. It sends a maximum of 10 records at a time. If it was able to send a record successfully, it deletes the record from the spool. If the daemon finds a record older than the “record_expiry” time, then it deletes that record. The daemon looks at a maximum of 20 records in a single spool run loop.
- rate_limit_enabled
This determines whether rate-limiting is enabled or disabled. When enabled, there is a threshold on both records sent within a window of time, and record bytes sent within a window a time.
- record_burst_limit
This is the maximum amount of records allowed to be passed by the daemon within the record_window_length of time. If set to -1, the rate-limiting for record bursts is disabled.
- record_window_length
The time, in minutes (0-59), that establishes the window length for the record_burst_limit. For example, if record_burst_window=1000 and record_window_length=15, then no more than 1000 records can be passed within any given fifteen-minute window.
- byte_burst_limit
This is the maximum amount of bytes that can be passed by the daemon within the byte_window_length of time. If set to -1, the rate-limiting for byte bursts is disabled.
- byte_window_length
This is the time, in minutes (0-59), that establishes the window length for the byte_burst_limit.
- rate_limit_strategy
This is the strategy chosen once the rate-limiting threshold has been reached. Currently the options are ‘drop’ or ‘spool’, with spool being the default. If spool is chosen, records will be spooled and sent at a later time.
- record_retention_enabled
When this key is enabled (true), the daemon saves a copy of the payload on disk from all valid records. To avoid the excessive use of disk space, only the latest 100 records are kept. The default value for this configuration key is false.
- record_server_delivery_enabled
This key controls the delivery of records to the server; when enabled (default value), the record will be posted to the address in the configuration file. If this configuration key is disabled (false), records will not be spooled or posted to backend. This configuration key can be used in combination with record_retention_enabled to keep copies of telemetry records locally only.
Note
Configuration options may change as the telemetry client evolves. Please use the comments in the default file itself as the most accurate reference for configuration.
Client run-time options
The Clear Linux OS telemetry client provides an admin tool called telemctl
for managing the telemetry services and probes. The tool is located in
/usr/bin. Running it with no argument results in the following:
sudo telemctl
/usr/bin/telemctl - Control actions for telemetry services
  stop       Stops all running telemetry services
  start      Starts all telemetry services
  restart    Restarts all telemetry services
  is-active  Checks if telemprobd and telempostd are active
  opt-in     Opts in to telemetry, and starts telemetry services
  opt-out    Opts out of telemetry, and stops telemetry services
  journal    Prints telemetry journal contents. Use -h argument for more
             options
start/stop/restart
The commands to start, stop, and restart the telemetry services manage all required services and probes on the system. There is no need to separately start/stop/restart the two client daemons telemprobd and telempostd. The restart command option will call telemctl stop followed by telemctl start .
is-active
The is-active option reports whether the two client daemons are active. This is useful to verify that the opt-in and opt-out options have taken effect, or to ensure that telemetry is functioning on the system. Note that both daemons are verified.
sudo telemctl is-active
telemprobd : active
telempostd : active