Major improvements in GCC 10.1
27 Jul, 2020
by Victor Rodriguez Bahena
Discover some of the latest features of GCC release 10.1, integrated in Clear Linux OS, and learn how to use them.
Introduction
It's been 33 years since the first release of GCC, and the GNU community keeps offering new features that surprise and inspire the imagination of developers. In 2020, the GNU* Compiler Collection (GCC) community gladly announced another major release, GCC 10.1. This release came with various optimization enhancements and bug fixes, several new hardware enablement changes, and enhancements to the compiler back-ends.
In the Clear Linux* Project, we want our users to easily access these new technologies to improve applications for customers by boosting their performance and providing a more robust layer of security protection against attacks. Included in GCC 10.1 is a new static analysis system that detects potential security vulnerabilities. This helps to speed up the development cycle as well as reduce debug time. In this blog post, I review some of the latest features of GCC release 10.1 already present in Clear Linux, explain some of their pros and cons, and show how to use them. I presented parts of this material as Toolchains in the New Era at the Embedded Linux* Conference 2020.
Security (-fanalyzer)
In the GCC release 10.1 a new option, -fanalyzer, was introduced to enable a new static analysis pass and associated warnings. This pass performs an exploration of paths through the code in the hope of detecting various common errors. Static security analysis is one of the many code review tools that can be implemented without executing the software. Enabling this option effectively activates some of these warnings:
- Wanalyzer-double-fclose
- Wanalyzer-double-free
- Wanalyzer-exposure-through-output-file
- Wanalyzer-file-leak
- Wanalyzer-free-of-non-heap
- Wanalyzer-malloc-leak
Having a static analysis tool native at compilation time can help to improve developer productivity. These warnings help developers to catch security vulnerabilities early.
One static analysis tool is the Wanalyzer-double-free warning that detects situations when free() is called more than once with the same memory address as an argument. When a program calls free() twice with the same argument, the program’s memory management data structures become corrupted and could allow a malicious user to write values in arbitrary memory spaces. This corruption can cause the program to crash or, in some circumstances, alter the execution flow.
David Malcom explains the motivation behind Static analysis in GCC 10 , where he applies the tool to an actual bug, CVE-2005-1689, showing how double free memory is exploited. This security bug was discovered on the Kerberos* computer-network authentication protocol a few years ago. The double free vulnerability in the krb5_recvauth function in MIT Kerberos 5 (krb5), in versions 1.4.1 and earlier, allows remote attackers to execute arbitrary code via certain error conditions. When doing a compilation with GCC10 and the new flag -fanalyzer,a warning appears on the same line of code where the patch for the fix is present. Developers can also take advantage of other flags, such as -fdiagnostics-format=json and -fdiagnostics-path-format=separate-events. An automation process can be implemented using these flags to post-process the verbose output log of the compiler in JSON format. This can be published as an HTML report, providing automated security checks.
Another example of a security vulnerability warning, present in -fanaliyzer, is Unsafe-call-within-signal-handler. A signal handler is a function which is called when the corresponding signal (a software interrupt delivered to a process) occurs. This diagnostic warns for paths through the code in which a function known to be async-signal-unsafe, such as fprintf, is called from a signal handler.
There are several circumstances where a function uses a signal handler that may result in the corruption of memory due to exploits of the process. Attackers may be able to exploit a signal handler to cause the software state to be corrupted, possibly leading to a denial of service or even code execution. The following code sample shows how the Unsafe-call-within-signal-handler warning detects a printf vulnerability.
#include <stdio.h>
#include <signal.h>
#include <stdlib.h>
#include <unistd.h>

void handle_sigint(int sig){
       if (sig == SIGINT){
             printf("SIGNAL: %d", sig);
             exit(-1);
    }
}

int main() {
             signal(SIGINT, handle_sigint);
             while (1)
             sleep(1);
             return 0;
}
In the following example, the compiler warns us from a call to ‘printf’ from within the signal handler. CWE-479 identifies a Signal Handler Use of a Non-reentrant Function, found in the common weakness enumeration (CWE™) database. A Non-reentrant function is a kind of function that cannot safely be called, interrupted, and then recalled before the first call has finished without resulting in memory corruption [2].
$ gcc test.c -fanalyzer
test.c: In function ‘handle_sigint’:
test.c:8:3: warning: call to ‘printf’ from within signal handler [CWE-479]
[-Wanalyzer-unsafe-call-within-signal-handler]

     8 |   printf("SIGNAL: %d", sig);
     |    ^~~~~~~~~~~~~~~~~~~~~~~~~
‘main’: events 1-2
     |
     |     13 | int main() {
     |          |          ^~~~
     |          |          |
     |          |         (1) entry to ‘main’
     |     14 |         signal(SIGINT, handle_sigint);
     |          | ~~~~~~~~~~~~~~~~~~~~~~~~~~~~~
     |          |          |
     |          |          (2) registering ‘handle_sigint’ as signal handler
     |

event 3
     |
     | cc1:
     |    (3): later on, when the signal is delivered to the process
     |
     +--> ‘handle_sigint’: events 4-7
     |
     |             6 | void handle_sigint(int sig){
     |             |        ^~~~~~~~~~~~~
     |             |        |
     |             |       (4) entry to ‘handle_sigint’
     |             7  |  if (sig == SIGINT){
     |             |        ~
     |             |         |
     |             |       (5) following ‘true’ branch (when ‘sig == 2’)...
     |             8   |     printf("SIGNAL: %d", sig);
     |             |   ~~~~~~~~~~~~~~~~~~~~~~~~~
     |             |   |
     |             |   (6) ...to here
     |             |   (7) call to ‘printf’ from within signal handler
After being warned about this security issue, a developer can adjust the code in multiple ways to ensure that non-reentrant functions are not present in the signal handlers, or ensure that they’re not being called outside the handler when the signal happens.
Despite the advantages of the new -fanalyzer static analysis system, there are some disadvantages. One of these is the large amount of spurious warnings/errors generated on the output log. As shown earlier, developers can take advantage of flags such as -fdiagnostics-format=json and -fdiagnostics-path-format=separate-events in order to post-process the output logs. The GCC community is investing time improving this to make developers pay attention to errors that matter and enhance the development speed.
Another disadvantage of -fanalyzer is the large amount of time it takes to run the analysis, which could slow down developer productivity. We should evaluate further the increase in compilation time and the fact that non-C code is unlikely to work (this analysis is much more expensive than other GCC warnings). I should acknowledge that the analyzer is in an experimental state; however I believe that the developer community will leverage and improve the static code analyzer available at the compiler. For more information about -fanalyzer, please refer to the official GNU documentation as well as the great work done in Static analysis in GCC 10 blog.
Profiling
Commonly, compilers have a section called code-optimization. The code-optimization phase attempts to improve the intermediate code so that better target code could be generated. Usually, better means faster, yet other objectives may also be desired, such as shorter code, better memory management, or target code that consumes less power. [3]
The compilers do these optimizations by using known heuristics, making most probable guesses about code execution. However, having exact information about which paths are taken during execution of the code, could help the compiler to avoid guessing and take the best action that best suits the needs of the users of the program. The profile-guided optimization (PGO) solves this problem. But how?
The PGO method is used by compilers to produce optimal code by analyzing application runtime data. Because this data comes directly from the application, the compiler can make much more accurate decisions. PGO optimizations have some significant advantage over traditional static optimizations as they are based upon how the application is likely to perform in a production environment. This allows the compiler to optimize for speed for common code paths and optimize for size for uncommon user scenarios. The result is faster and smaller code for the application with significant performance gains.
The PGO consists of three phases:
- Instrumentation : A compiler produces an instrumented binary that tracks and records information, such as direction taken by branches as well as the number of times a basic block runs.
- gcc -fprofile-generate=<profile_dir> my_app.c -o my_app_instrumented
- Profiled execution : Developers must execute the instrumented binary in the same way as users are expected to run the applications. Benchmarks and test cases are useful for this phase.
- ./my_app_instrumented
- Optimization: Information from the profiled execution compiler can better estimate the program’s control flow. The compiler produces a new executable file, relying on runtime information rather than the static heuristics.
- gcc -fprofile-use=<profile_dir> my_app.c
In the GCC release 10.1, a new option for profiling: -fprofile-partial-training was introduced apart from -fprofile-use. With -fprofile-use (Figure 1) all portions of programs not executed during the training run are optimized aggressively for size rather than speed.
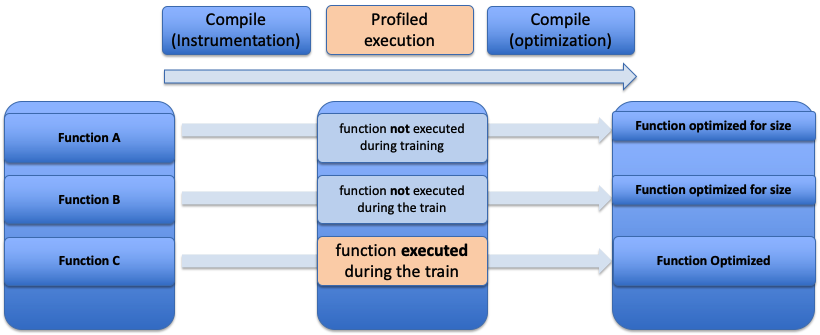
Figure 1 Regular fprofile-use flow
As shown in Figure 1, it’s not always practical to train all possible paths in the program. There might be blocks that are not covered during the profile execution due to the scope of the benchmark or test case. What happens when the users’ corner cases are not included in the profiled execution? Should they experience bad performance?
With -fprofile-partial-training (Figure 2) profile feedback will be ignored for all functions not executed during a training run, which leads them to be optimized as if they were compiled without profile feedback and should not be optimized for size.
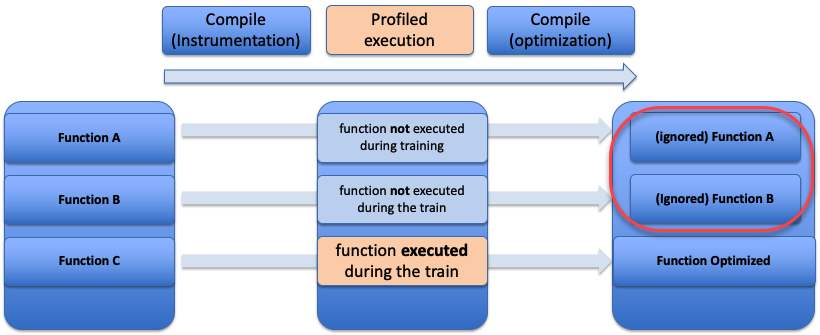
Figure 2 New fprofile-partial-training flow
Some of the most common and effective techniques during profile optimizations are function inlining, block ordering, and register allocation, among others. Following is a very simple example where profile optimizations improve the code:
#include <stdio.h>
#include <time.h>
#include <stdlib.h>

void B(int n);
int L(int n);


void B(int n){
	printf("Fibonacci !!!\n");
    int i, t1 = 0, t2 = 1, nextTerm;

    for (i = 1; i <= n; ++i) {
   	   printf("%d, ", t1);
   	   nextTerm = t1 + t2;
   	   t1 = t2;
   	   t2 = nextTerm;
    }
}

int L(int n){
	// Lucas number
	if (n == 0)
    	return 2;
	if (n == 1)
    	return 1;

	return L(n - 1) +
       	L(n - 2);
}

int main(int argc, char *argv[]){
	int i, n;
	time_t t;
	srand((unsigned) time(&t));
	int rand_num = rand() % 50;
	printf("Random number = %d\n", rand_num);

    if(argc>=2)
    	B(rand_num);
    else
    	printf("Lucas number:%d\n",L(rand_num));

	return 0;
}
When we compile this code in Clear Linux* OS version 33470 ( gcc profiling.c), we see that the order of the execution inside the main function represents the logic that we had in the source code:
if(argc>=2)
    	B(rand_num);
else
    	printf("Lucas number:%d\n",L(rand_num));


000000000000121c <main>:
[...]
1269:	jle	127e <main+0x62>
	126d:	callq  1189 <B>
[...]
	127e:	mov	%ebx,%edi
	1280:	callq  11e8 <L>
Here we compile with -fprofile-generate=. .
gcc -fprofile-generate=./data profile.c -o profile
When we execute the binary without any argument, the branch that is always chosen is the else part of the control flow. After this, the profile data stored in ./data directory will inform the compiler that the Lucas function is the one that has to be considered first.
if(argc>=2)
    	B(rand_num);
 else
    	printf("Lucas number:%d\n",L(rand_num));
$ ./profiling
Rand number = 40
Lucas number:228826127
$ ./profiling
Rand number = 11
Lucas number:199
$ ./profiling
Rand number = 44
Lucas number:1568397607
$ ./profiling
Rand number = 40
Lucas number:228826127
When we recompile the code with this information we can see that the order of logic has changed and the function used to calculate the Lucas number is closer to main since it is the function that has been executed more during our training use case:
$ gcc -fprofile-use=./data profiling.c -o profiling
0000000000001189 <main>:
	11c0:	callq  1040 <printf@plt>
	11c5:	cmp	$0x1,%ebx
	11c8:	jg 	11f0 <main+0x67>
	11ca:	mov	%ebp,%edi
	11cc:	callq  11f9 <L>
[...]
	11f0:	mov	%ebp,%edi
	11f2:	callq  122e <B>
	11f7:	jmp	11e4 <main+0x5b>
At this point we can see that the compiler has made a better decision based on the runtime information. However, what happens with the functions not exercised during runtime execution? When we compare function B, untouched during runtime execution after the compiler optimizes with -fprofile-use=, we see that the compiler does some optimizations that we didn’t request.
When we compile with the new GCC 10 option -fprofile-partial-training, we’re asking the compiler to ignore all functions not executed during the training run:
$ gcc -fprofile-partial-training -fprofile-use=./data profile.c -o profile
Analyzing the binary generated by the compiler, we see the expected results in the Fibonacci function. While it may seem counterintuitive to create a function without any kind of optimizations, in reality by not having any optimization, the code becomes neutral. This produces better performance for all the paths, even when the training run is not representative and leads to significantly more code. Before fprofile-partial-training, some optimizations could have a slight negative impact on non-profiled code paths.
There are other profile options included on the GCC release 10.1, such as -fprofile-reproducible which controls the level of reproducibility of profiles gathered by -fprofile-generate. This is useful for distribution packages. For more information about profile-partial-training please refer to the official GNU documentation.
Code health (-fno-common)
One of the most controversial changes is that now GCC 10 defaults to -fno-common. As a result, GCC will reject multiple definitions of global variables, as shown here:
$ cat a.c
int a = 10;

$ cat main.c
int a;
int main(){}

$ gcc a.c main.c -o main
/usr/bin/ld: /tmp/ccNzXJEe.o:(.bss+0x0): multiple definition of `a'; /tmp/cc55Za4a.o:(.data+0x0): first defined here
collect2: error: ld returned 1 exit status
There are two ways to fix this problem:
- Explicitly mark declarations as such and avoid multiple definitions in order to fix the bug. In the C programming language, an external variable
is a variable defined outside any function blockextern int a = 10; - As a workaround, legacy C code where all tentative definitions should be placed into a common block can be compiled with -fcommon
gcc a.c main.c -o main -fcommon
The addition of -fno-common will force other maintainers to adapt their packages to accommodate it. Some distributions and upstream projects already have patches to fix these problems. For more information about -fanalyzer please refer to the official GNU documentation.
Conclusion
With the early adoption of the latest GNU toolchain technologies, the Clear Linux Project sustains its leading-edge adoption of the latest open source technologies. GCC release 10.1 provides features to help developers detect security vulnerabilities and improve performance based on real use cases and new instructions for incoming hardware. In the Part 2 of this blog series, I will cover changes to improve control flow enforcement technology (CET) support and the new instructions for the Cooper Lake processors, among others changes in GCC10.There is always extra work on the enablement of new toolchains. However in the Clear Linux team, we believe that this effort is worth it, since these new capabilities inspire the imagination of developers across the world.
Call to Action
Want to get involved?
Join the GCC GNU mailing list: https://gcc.gnu.org/ml/gcc/
Find out more about the Clear Linux Project:
- Site:clearlinux.org
- Twitter: @clearlinux
- Forum:community.clearlinux.org
References
[1] https://owasp.org/www-community/vulnerabilities/Doubly_freeing_memory
[2] https://www.gnu.org/software/libc/manual/html_node/Nonreentrancy.html
[3] Aho, A. V., Lam, M. S., Sethi, R., Ullman, J. D., & Aho, A. V. (2007). Compilers: Principles, techniques, & tools. Pp 10